Icicle Chart
Icicle charts are used to visualize hierarchical data, and offer a way to easily spot clusters and understand to which level of a hierarchy they belong. Icicle charts also help to identify relationships in the data. However, when querying large hierarchies, it is difficult to review details of individual data points; for this reason, icicle charts are most powerful when working with smaller hierarchies, or when used to identify relationships and clusters.
Build an Icicle Chart
To build an icicle chart, add 1 blue chip to the Color zone; this is the hierarchy that will comprise the top level of the chart. Next, place the rest of the required hierarchies or hierarchy levels in the Details zone, and add a measure to Values.
Examples
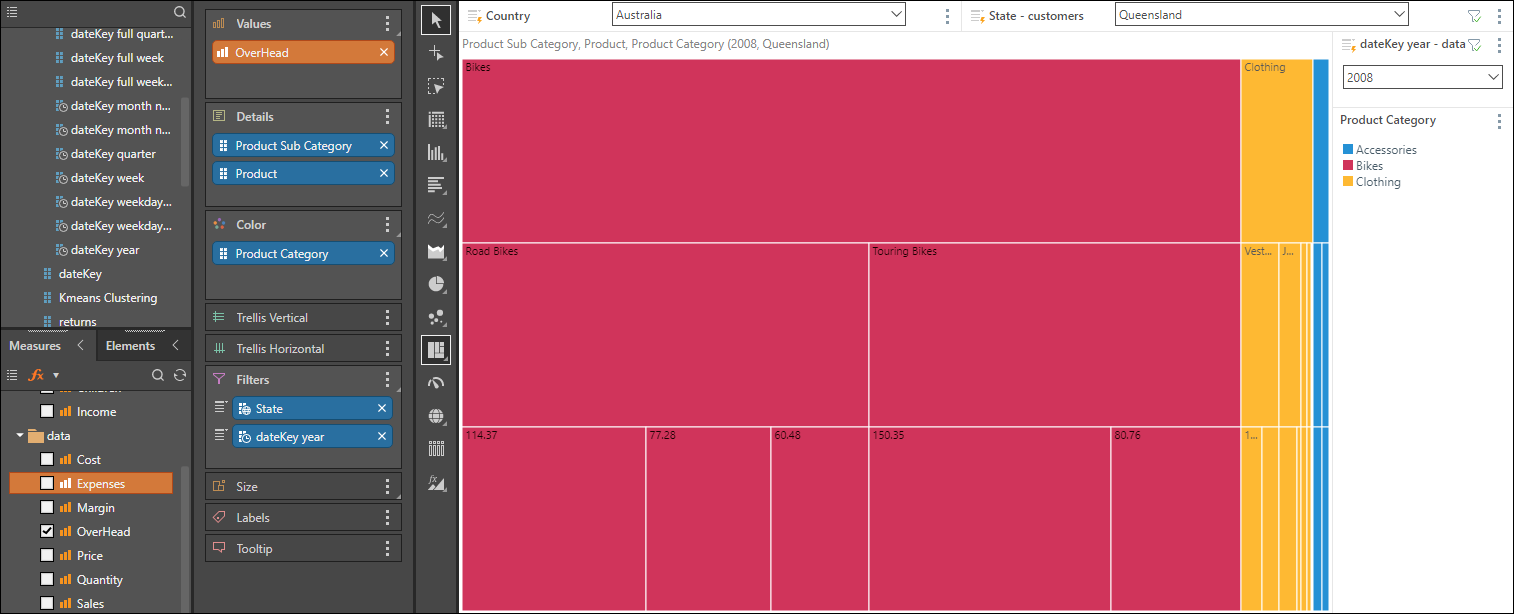
Example 1
In this example, the Product Category hierarchy was added to the Color drop zone, and the Product Sub Category and Product hierarchies added to Details. The given value is Overhead. The resulting chart displays the overhead for products in a hierarchical fashion, and color-coded by product category.
To streamline the results, a cascading filter was added to filter the query by state, as well as a year filter.
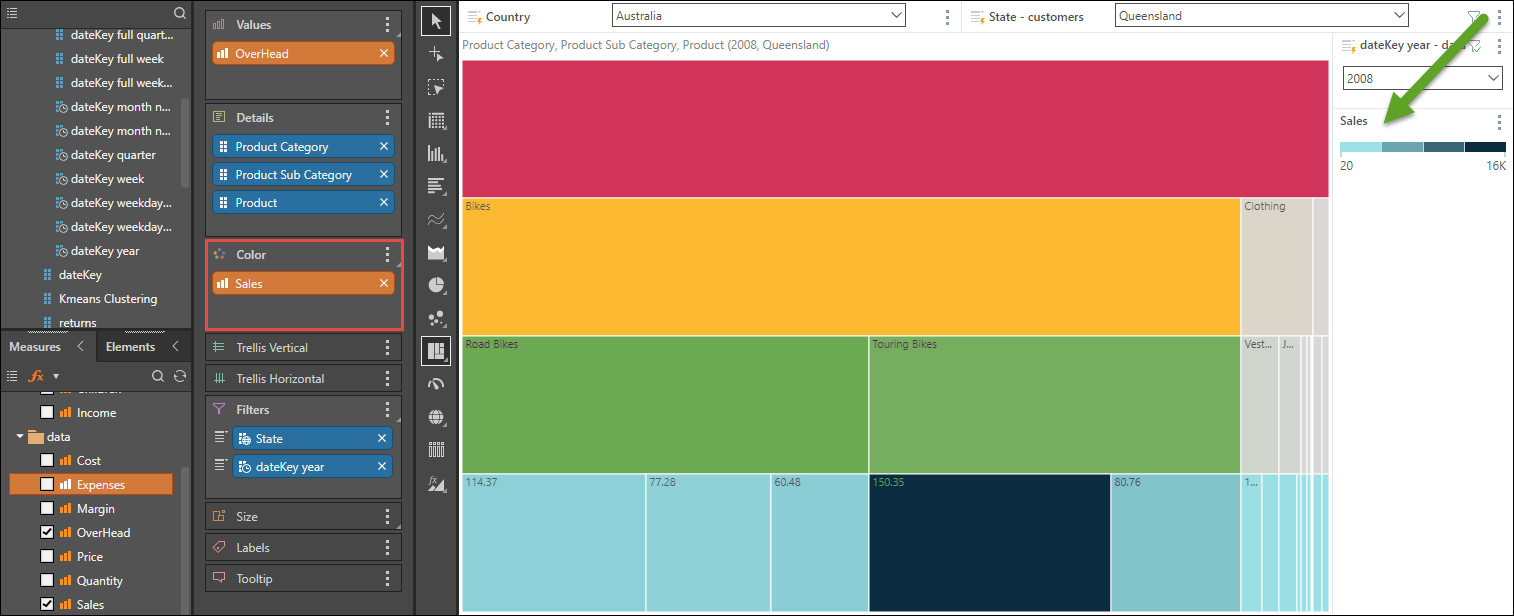
Example 2
In this example, the Product Category hierarchy was moved to the top of the Details drop zone, while a second measure - Sales - was added to the Color zone. The Product level of the chart is color-coded according to the Sales measure's continuous legend. In this way, the first measure (in the Values zone) drives the size of the chart segments, while the second measure drives the color.